

How SageMaker Debugger works
Archive of my old post from my blog. Explaining how Sagemaker debugger works.

This is an old post from the old blog thelastdev.com. I still remember the feeling when this Sagemaker feature released, I was very excited! Well, I will try to revive that post here. I updated the link references, it’s been 5 years after all😨, and I ensured the code here works as intended. I hope you find this post useful! Additionally, I have hidden some edits throughout the post, indicating how long ago I wrote the post 👀
Now before we begin, please let me know what you want to see (obviously new posts) in this substack by answering the following poll.
I have been using SageMaker for some time now, both for personal and professional use. SageMaker provides you a series of tools that every Data Scientist needs, but no obligations to use them all to produce a complete result. For example, SageMaker has a tool to tune your hyperparameters of your model called Automatic Model Tuning. You can use the Model Tunner if you want, but if you skip this tool, you still have the complete result. In other words, you can go and use whatever tool you may need, even in your local machine (using the SageMaker SDK) and create, train, and deploy your model seamlessly.

While I usually create and train a model in SageMaker, I want to have a complete overview of the progress to spot problems in the training process. For example, I want to know if my model is in a plateau or when I have an exploding tensor, etc When you are in your PC and your train the model in your own GPU, you can monitor everything, but when you are on the cloud and you train your model in a cluster of machines it is a bit difficult to monitor and debug everything. If something went wrong you need to know why and how to correct it. SageMaker now provides a tool called Amazon SageMaker Debugger that helps with the progress of the model’s training in a very detailed manner. I will use the Debugger on a previous post that I have made for “classifying the Fashion-MNIST dataset” (I will update this post and repost it here).
Difficulty and costs
Level: 300
Total Cost: Let’s say 1$ (with no Endpoint deployed)
Amazon SageMaker Notebook: ml.system for 24 hours -> 0.00364 x 24 -> 0.087$ + ml.t3.medium for 12 hours -> 0.7$ = 0.8$
Amazon SageMaker Training instance: 122 seconds in ml.c5.2xlarge -> 0.0019 x 122 = 0.14
Debugger Instance: 244 seconds in ml.t3.medium -> 0.003$
Amazon SageMaker Debugger
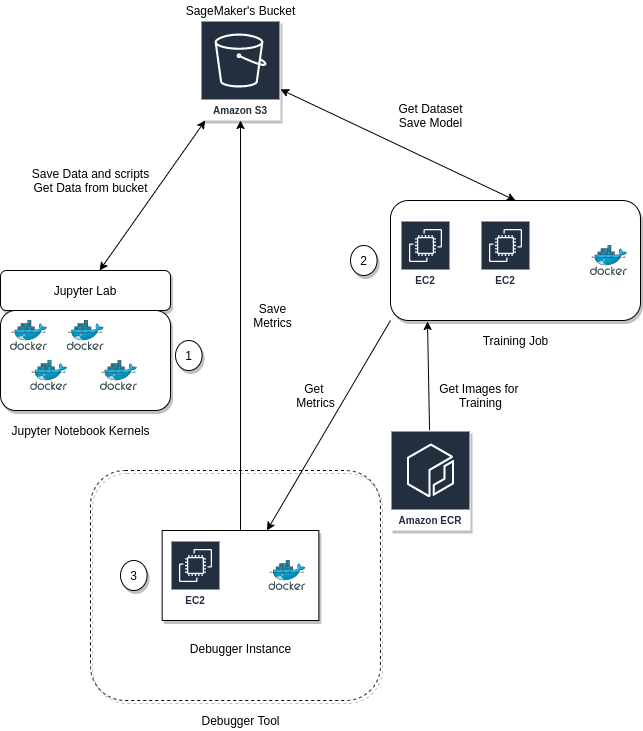
The Debugger is the fourth component in the equation, and it monitors the model, saves the metrics to S3, and can evaluate the metrics using something called Rules. Let’s take one piece at a time. You can add a Debugger Hook to your model on the circled number 1 in Figure 1. Once the job starts, that Hook will save metrics from your model as a tensor. Then (2) the hook listens for the requested metrics, creates the tensors, and saves them to S3. The debugger (3) can evaluate the model in real-time based on provided (built-in or custom) rules and decide if the training process was successful.
Add a Debugging Hook
Amazon SageMaker provides us a series of built-in Collections in order to monitor and save metrics (in a tensor format) of our model. Here is the list that we can use. For this example, we are saving the biases, the weights, and the metrics of our model.
from sagemaker.debugger import CollectionConfig, DebuggerHookConfig

bucket = sess.default_bucket()

collection_config_biases = CollectionConfig(name='biases')
collection_config_weights = CollectionConfig(name='weights')
collection_config_metrics = CollectionConfig(name='metrics')

debugger_hook_config = DebuggerHookConfig(
    s3_output_path=f"s3://{bucket}/fashion-mnist/hook",
    hook_parameters={
        'save_interval': '100'
    },
    collection_configs=[
        collection_config_biases,
        collection_config_weights,
        collection_config_metrics
    ]
)
To integrate the Debugger Hook to your model, add it to the estimator.
hyperparameters = {'epochs': 10, 'batch_size': 256, 'learning_rate': 0.001}

estimator = TensorFlow(
    entry_point='model.py',
    train_instance_type='ml.p3.2xlarge',
    train_instance_count=1,
    model_dir='/opt/ml/model',
    hyperparameters=hyperparameters,
    role=sagemaker.get_execution_role(),
    base_job_name='tf-fashion-mnist',
    framework_version='1.15',
    py_version='py3',
    script_mode=True,
    debugger_hook_config=debugger_hook_config,
)
In addition, you can create custom Debugger Hooks as shown in the following snippet. This snippet is from an AWS example on Debugger called Visualizing Debugging Tensors.
debugger_hook_config = DebuggerHookConfig(
    s3_output_path=f"s3://{bucket}/fashion-mnist/hook",
    collection_configs=[
        CollectionConfig(
            name="all_tensors",
            parameters={
                "include_regex": ".*",
                "save_steps": "1, 2, 3"
            }
        )
    ]
)
In this example, we are creating a Hook that will save all the tensors of our model. The AWS example has an amazing result, and I urge you to go and read it! More on custom Hooks here.
Analyze the Tensors
To analyze the tensors you need a SageMaker package that is called sm_debug and the documentation can be found here. With smdebug we fetch the tensors and explore them.
from smdebug.trials import create_trial
from smdebug import modes
import numpy as np
import matplotlib.pyplot as plt
# Get the tensors from S3
s3_output_path = estimator.latest_job_debugger_artifacts_path()
# Create a Trial https://github.com/awslabs/sagemaker-debugger/blob/master/docs/analysis.md#Trial
trial = create_trial(s3_output_path)
# Get all the tensor names
trial.tensor_names()
# Get the values of the tensor `val_acc`for mode GLOBAL (validation accuracy)
values = trial.tensor("val_acc").values(modes.GLOBAL)
# Convert it to numpy array
values_eval = np.array(list(values.items()))
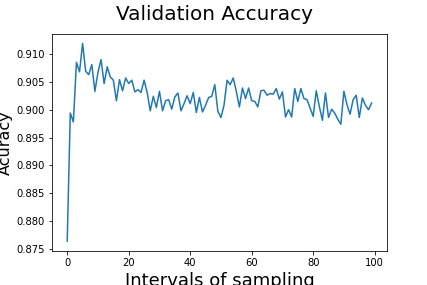
fig = plt.figure()
plt.plot(values_eval[:, 1])
fig.suptitle('Validation Accuracy', fontsize=20)
plt.xlabel('Intervals of sampling', fontsize=18)
plt.ylabel('Acuracy', fontsize=16)
fig.savefig('temp.jpg')First things first, let’s talk about what we just did. Initially, at line 8, we are fetching the location of the tensors in S3, then we create a trial to be able to query the tensors (line 11). Once we have the trial we are able to fetch all the tensor names (line 14) and with a specific name, in our case acc we are fetching the values for the validation accuracy (line 17), we are also using the modes to select the validation tensors. Finally, we convert the values to a NumPy array and we plot it.

There are so many possibilities for using tensors. Once you define a trial, you can use the SageMaker trials page to create all of your plots. This feature is available only on SageMaker Studio.
Add a Debugging Rule
Now that we have a Hook to create tensors from our model, we need to evaluate the model to see if the training was successful. We will set a SageMaker Rule that will read the tensors from our Debugger Hook and it will evaluate them. Be careful, you need to set up a hook for a Rule to extract and evaluate the tensors. Some amazing built-in rules will really help you evaluate your model. You can find the built-in rules here. I have only used built-in rules so far, so we will not dive into the custom ones. I will leave this for a future post, for now, you can take a look on awslabs examples here.
from sagemaker.debugger import Rule, rule_configs

estimator = TensorFlow(
    entry_point='model.py',
    train_instance_type=train_instance_type,
    train_instance_count=1,
    model_dir=model_dir,
    hyperparameters=hyperparameters,
    role=sagemaker.get_execution_role(),
    base_job_name='tf-fashion-mnist',
    framework_version='1.15',
    py_version='py3',
    script_mode=True,
    debugger_hook_config=debugger_hook_config,
    rules=[
        Rule.sagemaker(rule_configs.overfit()),
        Rule.sagemaker(rule_configs.loss_not_decreasing())
    ],
)
We have created two separate rules (more examples here).
The overfit rule where SageMaker will know when the model is overfitted and it will mark the training job as failed
The loss_not_decreasing rule where Sagemaker will monitor the loss and if it is stale then it will mark the training job as failed
Furthermore, we can go to the tensors, explore them, and find out at what step this problem occurred, why, and how we can prevent it.
Deliberately, I have increased the epochs of my example to 100, this may cause the model to overfit. Let’s see how SageMaker will react to that.

We can see that once the Training Job has started, we can go to the Experiments, search the trials nad find our Job. In the last tab, there is Debugger, that holds all the rules, both built-in and custom. We will see the verdict of the debugger once the job is done. SageMaker correctly captured the overfit. If we go to the tensors we can see that the training accuracy is very close to 1 and the validation accuracy is remaining the same.


You can also, create alerts when a rule condition is met. you can receive messages, stop the training job, etc. All of these will be covered in a future post. For now, you can follow awslabs examples here.
Conclusion
This post taught us how to debug our machine learning model in SageMaker. As you can see, once you get a grip on it, finding what you are looking for will be easy. Personally, I am very excited about this addition to SageMaker (lol, blast from the past, it’s been 5 years!). Debugger exists in the ecosystem of AWS and it can communicate with several other AWS services, such as Lambda. I hope I have shed some light on SageMaker Debugger in this post. If you have any questions, suggestions or requests, please let me know in the comments section below or message me at my BlueSky account @thelastdev.com or LinkedIn.
Till the next time, stay safe and have fun!